Go Local Interactive Blog

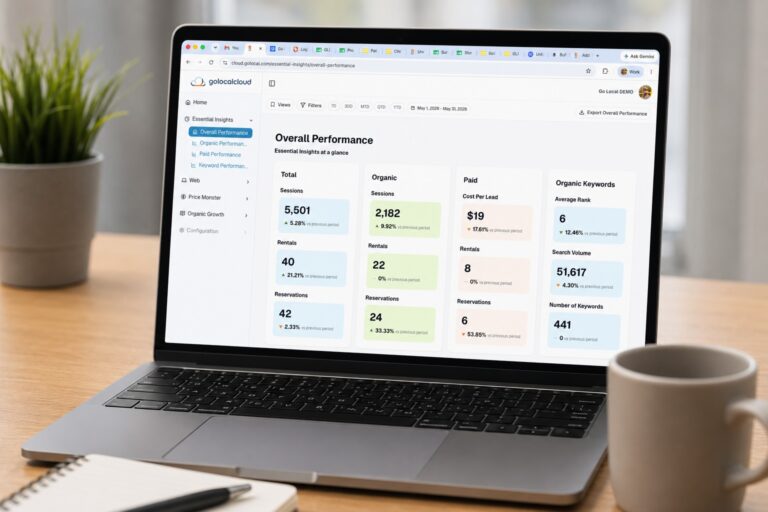
Go Local Cloud Product Update July 2026
Over the last six weeks, our core technology products got meaningfully better — some with new features, some with fixes you never had to notice because we caught them first. Here's the full rundown, organized by product.
Latest Posts


Let’s Work Together.
Get the best out of your digital marketing efforts with an expert agency. Contact us and let's get started driving success together.