
Everyone knows that content is vital to a digital marketing strategy. Good content is more likely to increase brand awareness, cultivate a brand connection, inform, educate, and convert than bad content, which could have wide-reaching negative consequences to your brand and website. Good content is the backbone of your website and your marketing, and its importance goes beyond organic traffic. You can have the best ad in the history of ads, but if the page your ad takes users to is poor, you won’t get the conversions you expect.
However, assigning ROI to content and measuring it for conversions is a tricky prospect. It’s easy to explain the difference between good and bad content, and it’s easy to understand the effect of that content–just think back to the last time you experienced an unhelpful web page and left to go explore the competition. Assigning that content an accurate monetary value is harder.
All is not lost, though, because:
- You can still measure content!
- You can still measure content for conversions!
In other words, you can evaluate your content beyond simply trusting that writing some blog posts is good because Google says content is important. You just need to think of content holistically, think out of the box a little, and embrace its role in the sales funnel.
Measuring Content Holistically
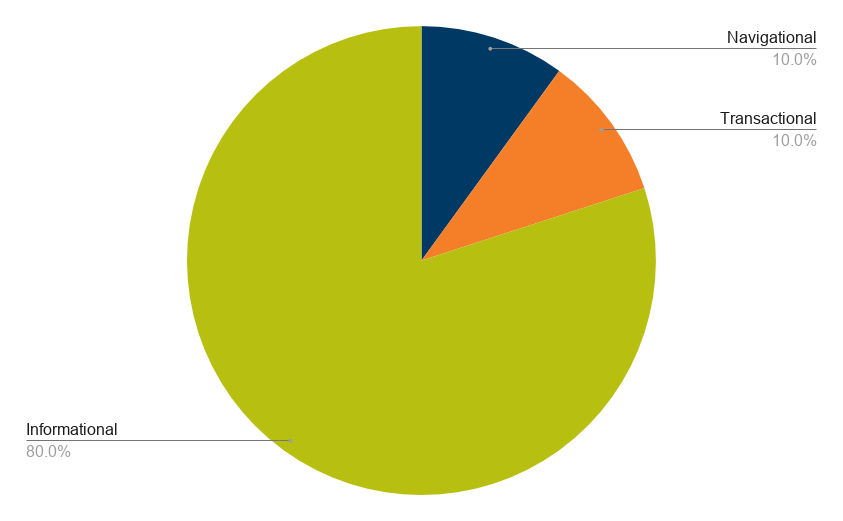
Not every search includes the same intent or is the same type. 80% of organic searches are informational; these searches feature users looking for answers to their questions like “how do I make soda bread” or “benefits of blue light blocking”. An additional 10% are navigational, like “bank hours” or “pharmacy near me”. This leaves only 10% of searches, according to studies, for direct transactional searches: people ready to purchase.
Companies are, naturally, heavily focused on that transactional 10%. They want to know the ROI for every digital marketing campaign in reference to those searches, those leads, and those sales.
And this is really important! In this age, companies shouldn’t let a marketing team pitch a campaign without some idea of what they’ll get out of it–we can’t just go around buying billboards because it “seems ok, I guess?”.
But that 10% focus leaves out 90% of your customer’s experience up to transaction time. And if this is the first time you’re coming up as a consumer option – well, how likely are you to be the choice in a sea of choices? How likely are you to show up at all, frankly, if the investment to the entire customer journey isn’t there? (Not you, specifically. You’re great.)
Many, many users do multiple rounds of research before deciding to buy. Thus, pages viewed in the 90% don’t get credit even though they helped lead to the 10%. But they are still important.
Measuring Informational Search Content: The 90%
Measuring content performance along the sales path means measuring engagement, both off the page and on. After publication (and some time after publication–content needs some time to gain new rank and viewers), you should see:
- An increase in pageviews: more people are reading your content
- An increase in entrances: more people are encountering your brand from this page
- An increase in targeted keyword rank: you’re showing up higher for these queries due to this page
- An increase in events: more people are taking the requested next step on the page (micro goals, like next page clicks, button clicks, or downloads).
And if engagement metrics aren’t improving, of course, it’s still useful data you can use to change your strategy.
One word of caution, however: you can certainly look at decrease in exit rates as a KPI–but be careful measuring average time on page and bounce rate. They are frequently misleading numbers and won’t tell the full story of viewer engagement.
Alongside these core metrics, an increase in ranking that results in a rich snippet (or rank zero) spot or voice search result is obviously awesome. But while content should be written with those results in mind, they should really be considered extra sprinkles on the sundae, not the ice cream itself.
Why isn’t this the case? To achieve a rank zero spot on Google, content only plays one (albeit important) role. Factors like external links, page speed, and search query play are also important. In addition, rank zero results tend to fluctuate heavily as Google tests new algorithms, through no fault of the websites they pull from. The best chance to achieve a rank zero spot is through a multi-pronged, holistic strategy, taking into account SEO, content, and web.
We know that featured snippets are frequently chosen for voice search results. Unfortunately at this time, there’s no such thing as voice search reporting. We can’t log into Analytics to see what queries people asked Alexa or Echo to get to our brand, or how often we showed up. Without measurement we can’t have metrics. ¯\_(ツ)_/¯
But what data we do have is really powerful.
Measuring Transactional Search Content: The 10%
One of the reasons why content is difficult to measure is that plenty of content contributes to a sale without directly influencing the sales path. That’s partly because of how your data is collected and partly because it’s impossible to exactly determine how much credit each page should have in the conversion process.
Every time I visit your site, my actions are recorded per visit–that is, per session. Some information is also saved for me, an individual user, but not a whole lot. Information isn’t really tracked by user across their multiple sessions, which means there are some breaking points in the sales funnel.
Let’s walk through a fairly typical experience: Me, a person with a healthy respect towards venomous spiders, encountering spiders in my home.
–––––––––––––––––––––––––––––––––––––––––––––––––––––––––––––––––––––––––––––––––––
Day 1: I see a lot of spiders. :/
Day 2: There are even more spiders. I perform a search about spiders and read your blog article on spider infestations. I then navigate to the pest library, and see that these visitors are definitely not friendly ones i want to keep around. Yikes!
Day 3: I’ve decided I can’t handle this on my own. I visit your site again, and two other competitors, to get some price and service estimates. I review it with my partner that evening. We do so as far away from the garage of spiders that it is humanly possible to be while still technically contained within the house.
Day 4: Once we’ve selected you–you helped me figure out the problem in the first place, your service looks great, and the costs affordable–I return to your website to request service.
–––––––––––––––––––––––––––––––––––––––––––––––––––––––––––––––––––––––––––––––––––
All of those pages were very important to me. I wouldn’t have thought to come to your website for a quote if I hadn’t already conducted those informational searches.
However, when measured for conversions, only the content in that last session–your location page, and service form page–get the credit. This is similar to last click attribution in paid search, and its pitfalls–although that, at least, is easy to change.
This tracking issue isn’t easy to change. We’re not able to properly distribute credit, and have to rely on increased engagement for success.
(P.S. I like spiders and they are welcome to live nearby.)
We Can Still Measure Conversions
We can’t measure for conversions every time. But it’s not impossible, and we can absolutely measure conversions in certain circumstances.
For instance, it’s possible to see, in the story above, the importance of the location page I visited in the session before I went to your service form page. By default in Analytics, you’re seeing on what pages goals happen. This is not super useful if you’ve put your goals on specific pages, right? How do you see the lead-up?
Create a custom segment. In the Behavior Report of Analytics, go to Add Segment > New Segment > Advanced > Conditions. This is where we’re creating a data layer that shows all of the content that helped produce your goal.
This will already be set to Sessions: Include – leave that as is. You’ll want to change the selection dropdown to the specific goal you’re measuring). Define this as “per session = 1”.
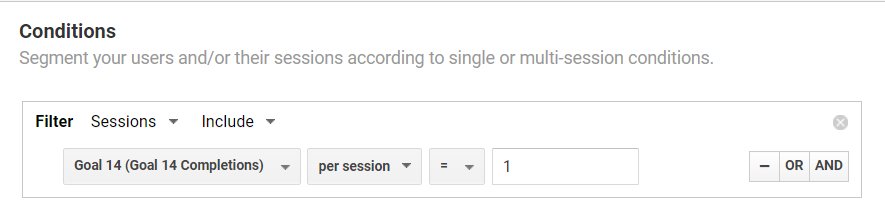
Simply hit save and apply.
Now we’re seeing only sessions where that conversion was completed. By goal, we can analyze what pages were viewed and how that compares over time. We can compare this to all sessions, or even further refine the data layer–perhaps you want to compare organic sessions and direct sessions for content contributing to conversions.
Knowing that this content has produced these many goals make an ROI calculation clear: for every penny you’ve spent creating the page, you’ve made hundreds of dollars over time. That’s another great thing about content: it’s compounding, so paying once for that location page will net you new leads year after year.
Giving Credit
I’m sometimes asked by companies whether the SEO or content program produced these additional organic sales. The honest answer is that I have no idea–no one does. It’s impossible to separate their contributions to your website, as they work in tandem towards the same goals and with largely the same strategies (if different tactics).
Traditionally, though, a lot of SEO companies end up taking full credit for the organic traffic and leads. They did a lot of it, but those are shared wins, and content shouldn’t be relegated to a gantt chart or year-end appraisals. To help keep the spotlight on such an important program to your website, keep measuring those pageviews, entrances, and other wins–yes, including goals.
At Go Local Interactive, we can help you achieve organic search success. Our content and SEO teams are experts at what they do, and we know how to measure your content as best as possible. Contact us today and we’d be happy to perform a free digital marketing analysis for you to help you improve your business.