
As the world learns how to live with COVID-19, its impacts on the economy are leveling out. A number of industries that once saw large increases in demand are now equalizing as life returns to normal. The self storage industry is no different. The demand the industry has seen over the past two years has led to exponential growth backed by increasing migration patterns and a sudden influx of remote workers. COVID has injected the self storage industry with a shot of adrenaline, and that is evident in Google searches for storage. This analysis looks at the performance of storage-related Google searches in aggregate using Google Trends and Google Keyword Planner to evaluate last year’s performance.
2022 Year in Review
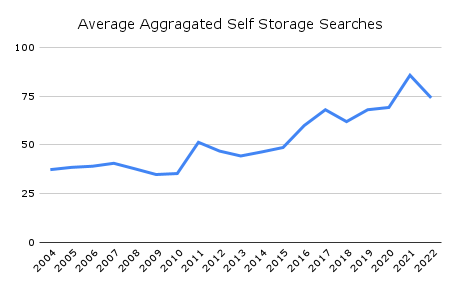
Searches for storage-specific keywords have set new highs over the last two years. While peaking at an all-time high in 2021, searches normalized in 2022, falling 14%. Even with the year-over-year decline, 2022 is still the second-best year on record for Google searches.
2022 vs. 2020
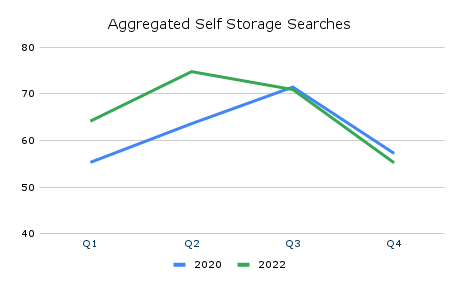
Since 2021 was an aberration, we’ll put it aside for this year-over-year comparison and look at 2022 versus 2020. In terms of 2022’s performance, it was a tale of a hot start and a cool ending. Altogether, self storage searches were 17% higher in 2022 compared to 2020. Shown below is how all of the gains were in the first two quarters. During the final two quarters, demand saw a decline, with the fourth quarter accounting for a majority of that. As 2022 progressed, storage searches hit a wall in the second half, preventing a successful year from being even more successful.
Searches by State
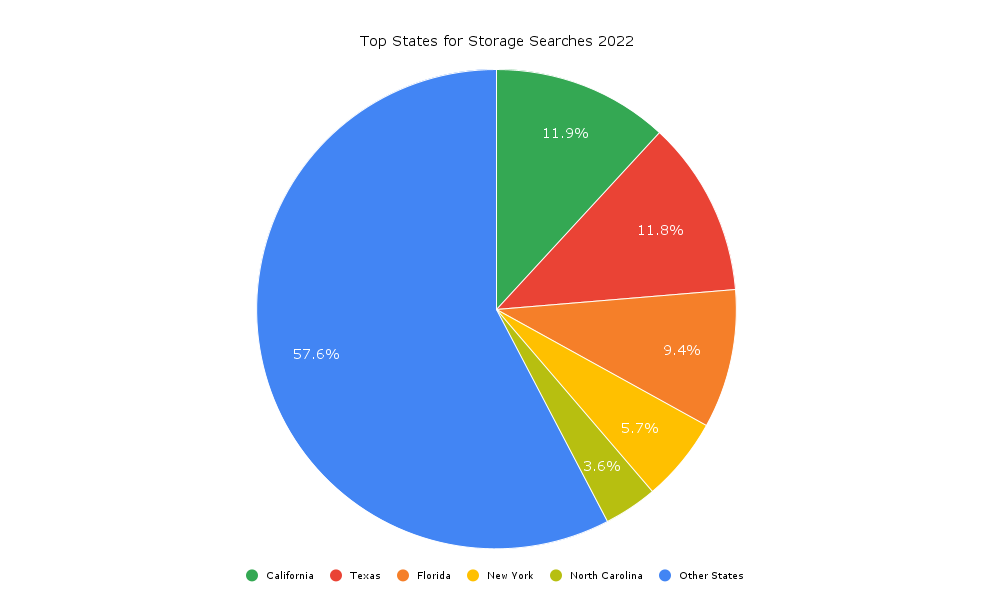
It comes as no surprise that the top four most populous states accounted for the most storage searches in order of population. Most noteworthy is number five, North Carolina. Even though it is the ninth most populous state, there was enough demand there for storage searches that they ranked fifth in 2022. This indicates that North Carolina could be an opportunistic state for self storage. Collectively, these five states accounted for 42% of all storage searches in 2022.
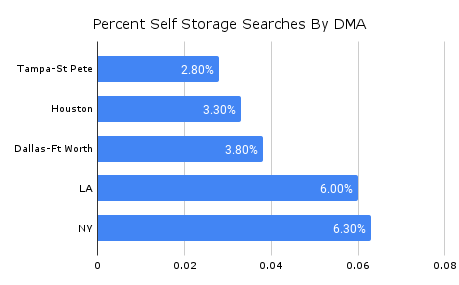
By DMA
The list of top DMAs (designated marketing areas) for self storage brings a few surprises. No one is surprised to see New York and Los Angeles at the top of this list, both averaging at least 6% of U.S. storage searches. Dallas and Houston are no surprise either but do perform above their population size. Dallas is fifth in terms of DMA population but ranks third. Houston is eighth in terms of population but ranks fourth. Most noteworthy is Tampa-St Pete. Even though this DMA is thirteenth in terms of population, it is fifth for storage searches. This indicates that Tampa-St Pete is a potentially good market for storage. These top six DMAs make up 22% of all storage searches in the U.S.
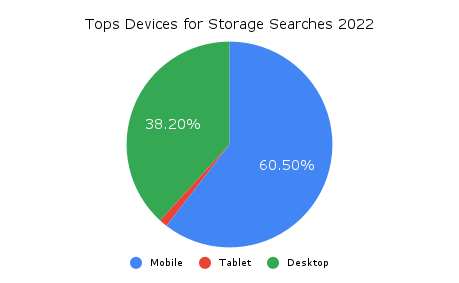
More Searches Are Mobile
Mobile traffic continues to dominate storage searches, accounting for nearly 63% in 2022. That was a two percentage point increase from 2021. Desktop searches are still significant but are falling every year. From 2021 to 2022, desktop searches lost 2.2 percentage points. Tablet traffic continues to hold steady year over year.
Conclusion
2022 was the second-best year for storage searches since 2004, according to Google Trends. The problem is that 2021 takes first place by a large margin. Much like a younger brother living in the shadow of the older brother, 2022’s success is easily overlooked after 2021’s success. But once you step back and look at the bigger picture, you can see it was a great year for storage demand via search. All signs point toward searches and rates likely shifting more in 2023, coat-tailing off a poor Q4 performance in 2022. Despite this trend, the foundation of the storage industry remains strong as demand normalizes.
*Note: Some of this analysis was done using Google Trends. Google Trends normalizes data by dividing each data point by the total searches in a given time frame, geography, or subject to give its relative popularity. A score of 100 indicates maximum volume based on a topic’s proportion of all searches on a topic. This analysis was done in the storage category, so all data shown is in relation to all storage searches on Google.