Essential Insights Just Got Sharper
June-18-2026 by Shane Adams in News
Share on Twitter,
LinkedIn
Self-storage operators are managing more data than ever — occupancy trends, lead sources, campaign performance, cost per rental. The reporting tools they rely on need to keep up. Slow dashboards, clunky exports, and filters that don’t behave the way you expect them to aren’t just annoyances. They cost time, and they create doubt in the numbers.
Clear, fast, reliable reporting is the baseline. Every decision about where to spend budget, which locations need attention, and how campaigns are performing runs through it.
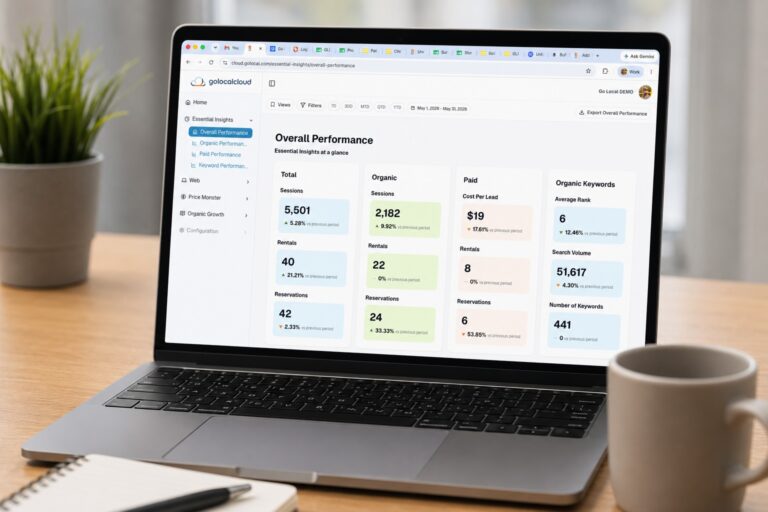
Your dashboard should work as fast as you think. With this round of updates to Go Local’s reporting and analytics tool, Essential Insights, it’s closer than ever.
We’ve shipped improvements across five areas — date filtering, table filtering, exports, saved views, and reporting transparency — and the theme is the same throughout: less friction, more control.
Here’s what changed:
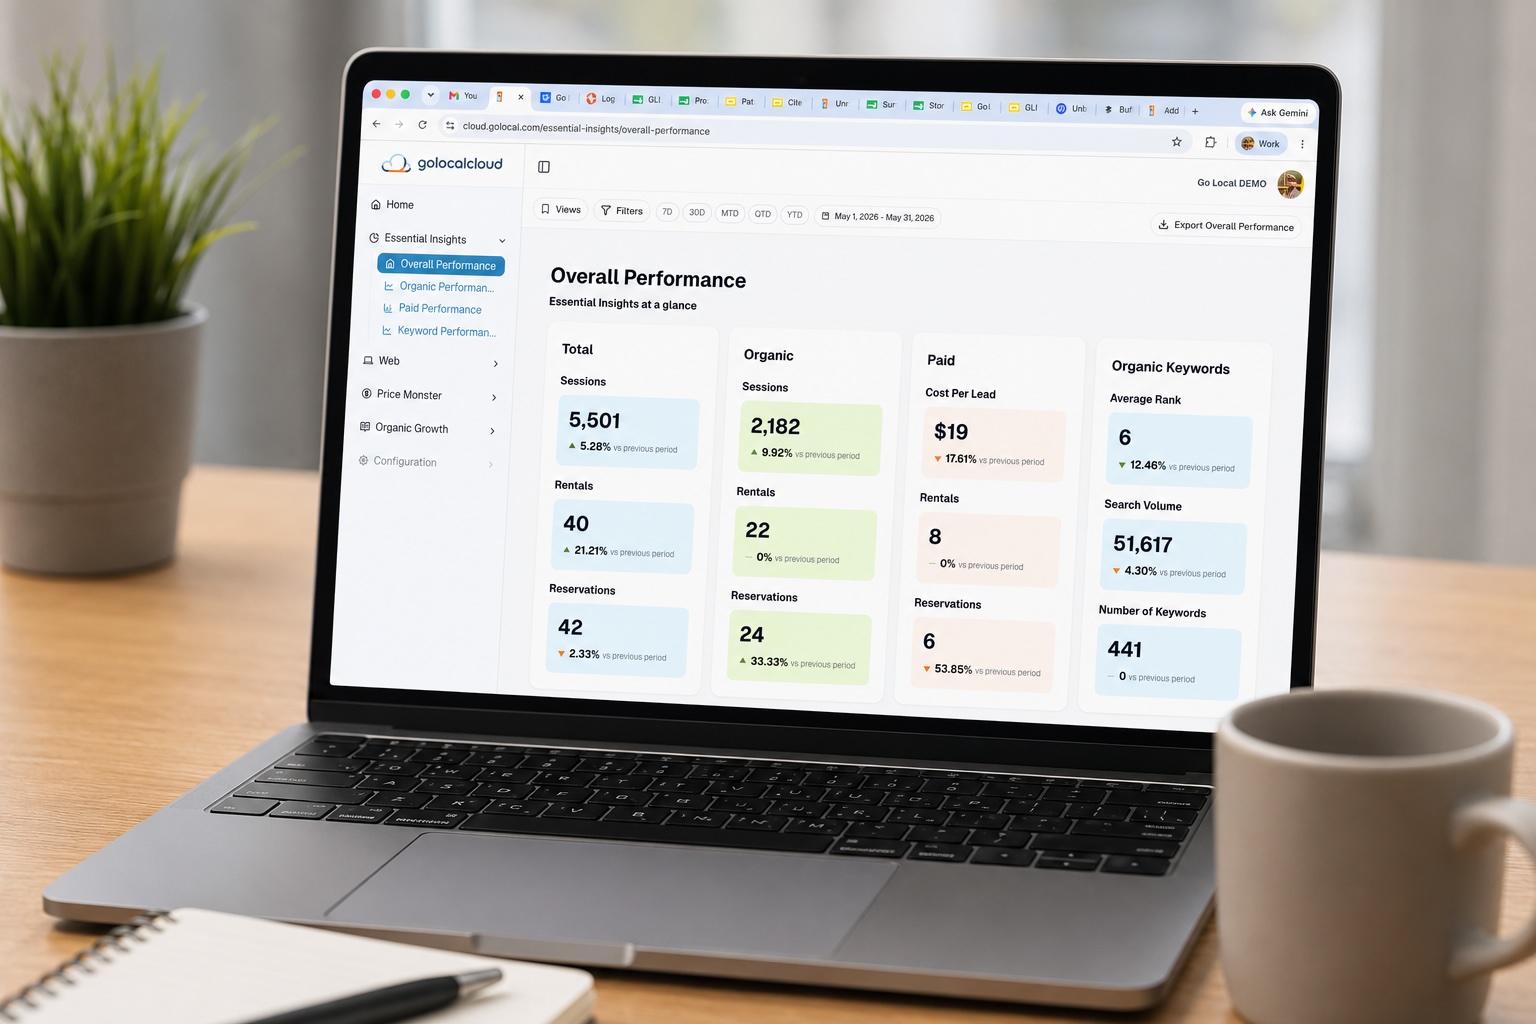
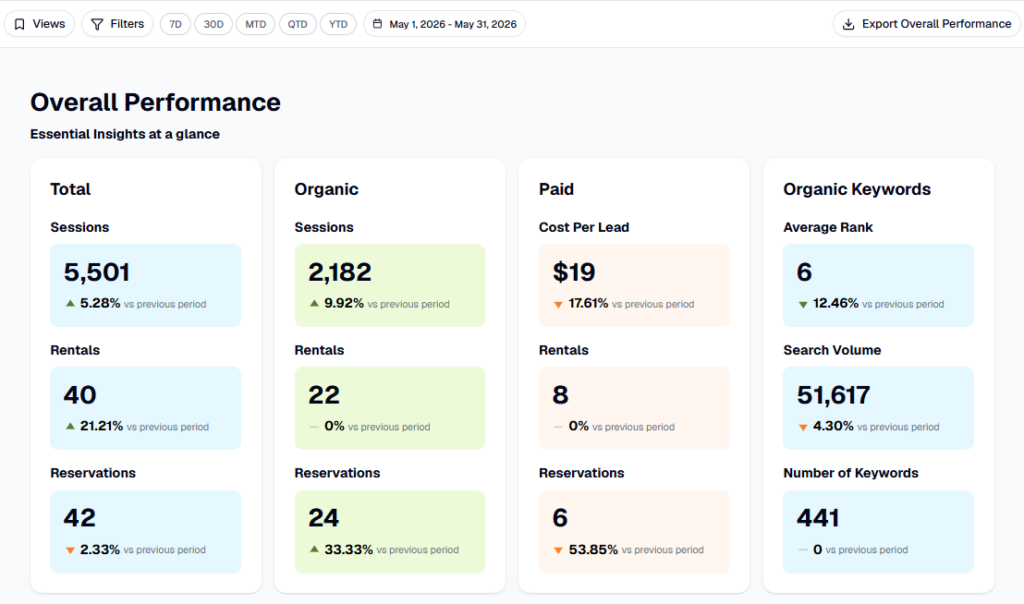
Faster Date Filtering
The quick-select buttons — 7D, 30D, MTD, QTD, YTD — are now pinned to the top of your dashboard at all times. Switching time periods is a single click. No date picker required.
If you need a custom range or want to run a comparison period, that’s still available. Click the date range badge and the full picker opens. But for day-to-day use, one click gets you there.
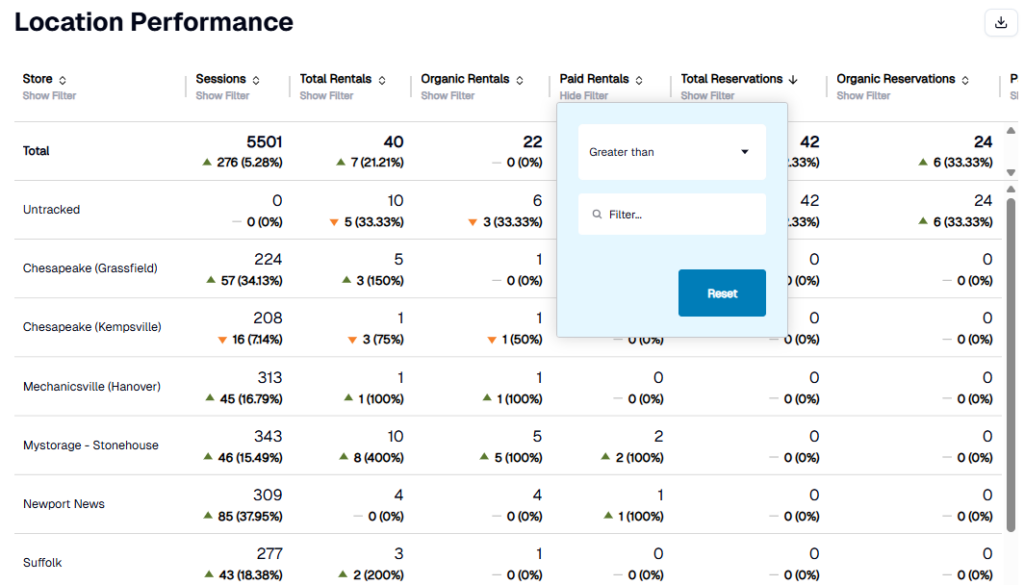
More Powerful Table Filtering
You can now filter data within any table using conditions: greater than, less than, equal to, or between a range. Stack filters across multiple columns at the same time.
Results update instantly. When you’re done, clearing your filters returns you to the full dataset — no page reload, no extra steps.
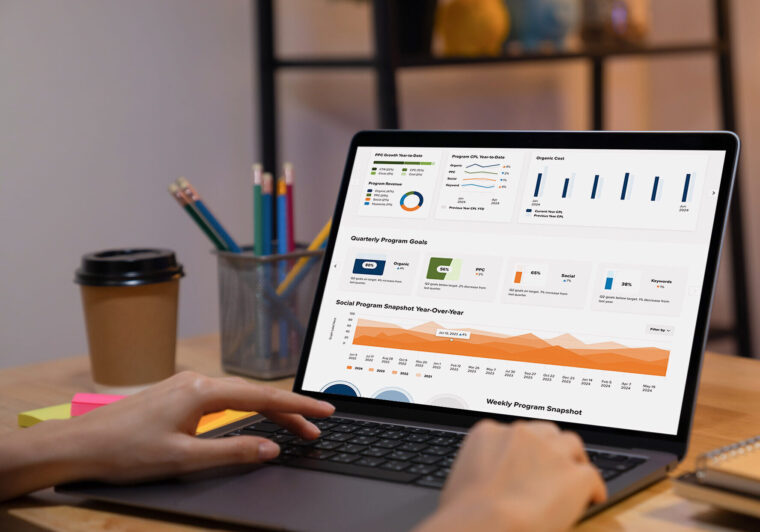
Improved Exports
Exports now reflect exactly what you see. Active filters carry through, so you’re not exporting your entire dataset when you only care about a slice of it.
A few other improvements worth noting:
- Location Performance exports now include all paginated rows — not just the page you’re viewing
- PDF export is now available for individual dashboard components, alongside the existing CSV and Excel options
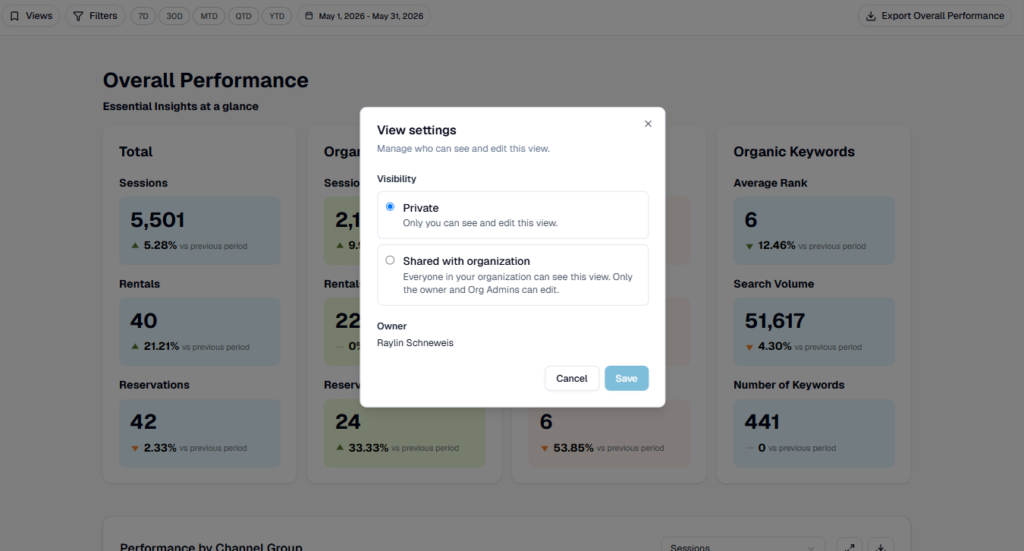
Saved View Enhancements
Saved views have been one of the most-used features in Essential Insights. They’re more flexible now.
You can edit an existing view — update its filters or rename it — without starting from scratch. You can duplicate a view to spin up a quick variation. And you can choose whether a view is shared with your organization or kept private.
Build the views that match how your team actually works.
A Note on Lead & Rental Reporting
You may notice slight differences in lead counts between the Location Performance and Campaign Performance tables. That’s expected behavior, not a discrepancy.
Each table pulls call data from a different source. Location Performance uses call tracking at the facility level; Campaign Performance uses call tracking at the campaign level. They’re measuring the same activity from different vantage points, so the numbers won’t always match exactly.
We’ve updated our Essential Insights Glossary with a full breakdown of how Leads, Converted Rentals, and Cost Per Rental are calculated in each view. If you need access to the Glossary, reach out to your Client Success Manager.
If you have questions about your lead reporting, reach out to your Go Local account team. We’re happy to walk through it.
More Case Studies & Blogs

How a social media strategy doubled visibility, generating a 50% increase in online conversions and sales.
Let’s Work Together.
Get the best out of your digital marketing efforts with an expert agency. Contact us and let's get started driving success together.